
Article type: Report
5 May 2026
Volume 48 Issue 1
HISTORY
RECEIVED: 12 September 2025
REVISED: 21 January 2026
ACCEPTED: 2 February 2026
Article type: Report
5 May 2026
Volume 48 Issue 1
HISTORY
RECEIVED: 12 September 2025
REVISED: 21 January 2026
ACCEPTED: 2 February 2026
![]() Clearer signals, earlier action: Using data to make better decisions for children
Clearer signals, earlier action: Using data to make better decisions for children

Elodie O'Connor1,2 PhD, Research Fellow 

Jacqui McCann1,3 Policy Manager

Olivia Hilton1 General Manager

Sarah Gray1,2 PhD, Senior Research Officer

Alex Fischer4 PhD, Senior Fellow

Lynne Millar1,5 PhD, Senior Research Manager and Adjunct Senior Research Fellow

Sharon Goldfeld1,2 PhD, Director and Professor *
Affiliations
1 Centre for Community Child Health, Murdoch Children’s Research Institute, Royal Children’s Hospital, Melbourne, Vic., Australia
2 Department of Paediatrics, University of Melbourne, Melbourne, Vic., Australia
3 Social Ventures Australia, Sydney, NSW, Australia
4 Human Technology Institute, University of Technology, Sydney, NSW, Australia
5 University of Western Australia, Perth, Australia
Correspondence
*Prof Sharon Goldfeld
Contributions
Elodie O'Connor - Study conception and design, Drafting of manuscript, Critical revision
Jacqui McCann - Study conception and design, Drafting of manuscript, Critical revision
Olivia Hilton - Study conception and design, Drafting of manuscript, Critical revision
Sarah Gray - Drafting of manuscript, Critical revision
Alex Fischer - Drafting of manuscript, Critical revision
Lynne Millar - Drafting of manuscript, Critical revision
Sharon Goldfeld - Study conception and design, Drafting of manuscript, Critical revision
Elodie O'Connor1,2
Jacqui McCann1,3
Olivia Hilton1
Sarah Gray1,2
Alex Fischer4
Lynne Millar1,5
Sharon Goldfeld1,2 *
Affiliations
1 Centre for Community Child Health, Murdoch Children’s Research Institute, Royal Children’s Hospital, Melbourne, Vic., Australia
2 Department of Paediatrics, University of Melbourne, Melbourne, Vic., Australia
3 Social Ventures Australia, Sydney, NSW, Australia
4 Human Technology Institute, University of Technology, Sydney, NSW, Australia
5 University of Western Australia, Perth, Australia
Correspondence
*Prof Sharon Goldfeld
Part of Special Series: Articles from the National Early Years Policy Summit, 2025![]()
CITATION: O'Connor, E., McCann, J., Hilton, O., Gray, S., Fischer, A., Millar, L., & Goldfeld, S. (2026). Clearer signals, earlier action: Using data to make better decisions for children. Children Australia, 48(1), 3087. doi.org/10.61605/cha_3087
© 2026 O'Connor, E., McCann, J., Hilton, O., Gray, S., Fischer, A., Millar, L., & Goldfeld, S. This work is licensed under the terms of a Creative Commons Attribution 4.0 International Licence
Abstract
Australia is striving for ambitious early childhood reform, both nationally and within local communities. Despite the scale of change, we are not consistently using the best available information and data to guide critical decisions about children’s health, wellbeing and development. The problem lies not only in data gaps, but in how we use and apply the data that do exist. There is broad agreement that ensuring data play a central role in driving more equitable outcomes for our youngest Australians is critical to effective change.
Despite vast amounts of data across health, education and social services, their impact remains limited. Fragmented systems, inconsistent definitions, disconnected technologies and non-evidence-informed indicators leave local early years partnerships, services and governments without the information needed to drive improvement at speed and scale. At the same time, critical gaps persist. Timely, actionable data to demonstrate what is driving outcomes, and feedback data to support continuous improvement, are often missing.
This paper proposes an early years data logic – a structured approach that signposts what data are needed, for what purpose and how data can be used. Anchored in principles of equity, precision, access, evidence and utility, and supported by good data governance, the logic aims to provide a roadmap that ensures the right data are in the right hands at the right time for the right purpose. It makes clear why data are collected and how data can be used to drive change.
By making purpose explicit, a data logic can guide decision makers at all levels. It clarifies how the system is functioning, highlights which children and families most need support and identifies the gaps that require targeted action to achieve change. It also positions data as a resource for learning, enabling decision makers and frontline practitioners to generate insights, test approaches and adapt through cycles of continuous improvement.
There are current challenges, including over-reliance on population-level outcome (lag) measures, inconsistency in definitions and measures used to track progress, and limited workforce capability and inaccessible information systems. However, this paper outlines practical recommendations to mitigate these challenges. These include roles for government, funders, data stewards, local early years partnerships (such as place-based initiatives and integrated service hubs) and services in embedding the logic in practice. Examples from promising initiatives illustrate how better use of data can improve equitable access, service quality and participation. These positive examples sit alongside our practical recommendations to highlight how improvements are possible.
Ultimately, this data logic offers a roadmap for shifting from systems that may be data rich but insight poor to a connected ecosystem capable of delivering on the promise of equity. By embedding a shared logic across early years systems, Australia can ensure that every child is visible, every service is accountable and every decision is informed – enabling change at speed and scale.
Introduction
Every child in Australia deserves the opportunity to thrive. Yet despite decades of investment, inequities in child development persist (Goldfeld et al., 2024; Mitchell Institute, 2025). Inequities are driven by the circumstances in which children live, learn and grow (Commission on Social Determinants of Health, 2008). These inequities are not inevitable; they are the result of unfair and unjust differences caused by preventable social, economic or geographic factors (World Health Organization, 2025). For a high-income country, this is a significant system failure that demands urgent, coordinated action.
Early childhood (from conception to 8 years of age) is a critical period for growth, with rapid brain maturation laying the foundations for lifelong health, development and wellbeing (Woolfenden et al., 2013). When inequities emerge during these years, they generally persist into adulthood, resulting in substantial costs for individuals and society (Heckman & Masterov, 2007; Woolfenden et al., 2013).
Despite significant investment, inequities persist in part because Australia’s early years systems lack a coherent approach to collect, connect and use data across parts of the system – limiting the ability to see need clearly, coordinate responses and act proportionately.
Equity in early childhood is not just a moral imperative – it is a measurable, actionable goal. To achieve equity, we must first be able to see where inequities exist: who is missing out, where there are service gaps and which interventions are making a difference. Data are central to this task – with opportunities to learn from practices in sectors like business (see Box 1). When connected and interpreted with purpose, data can reveal patterns, track change and guide investment.
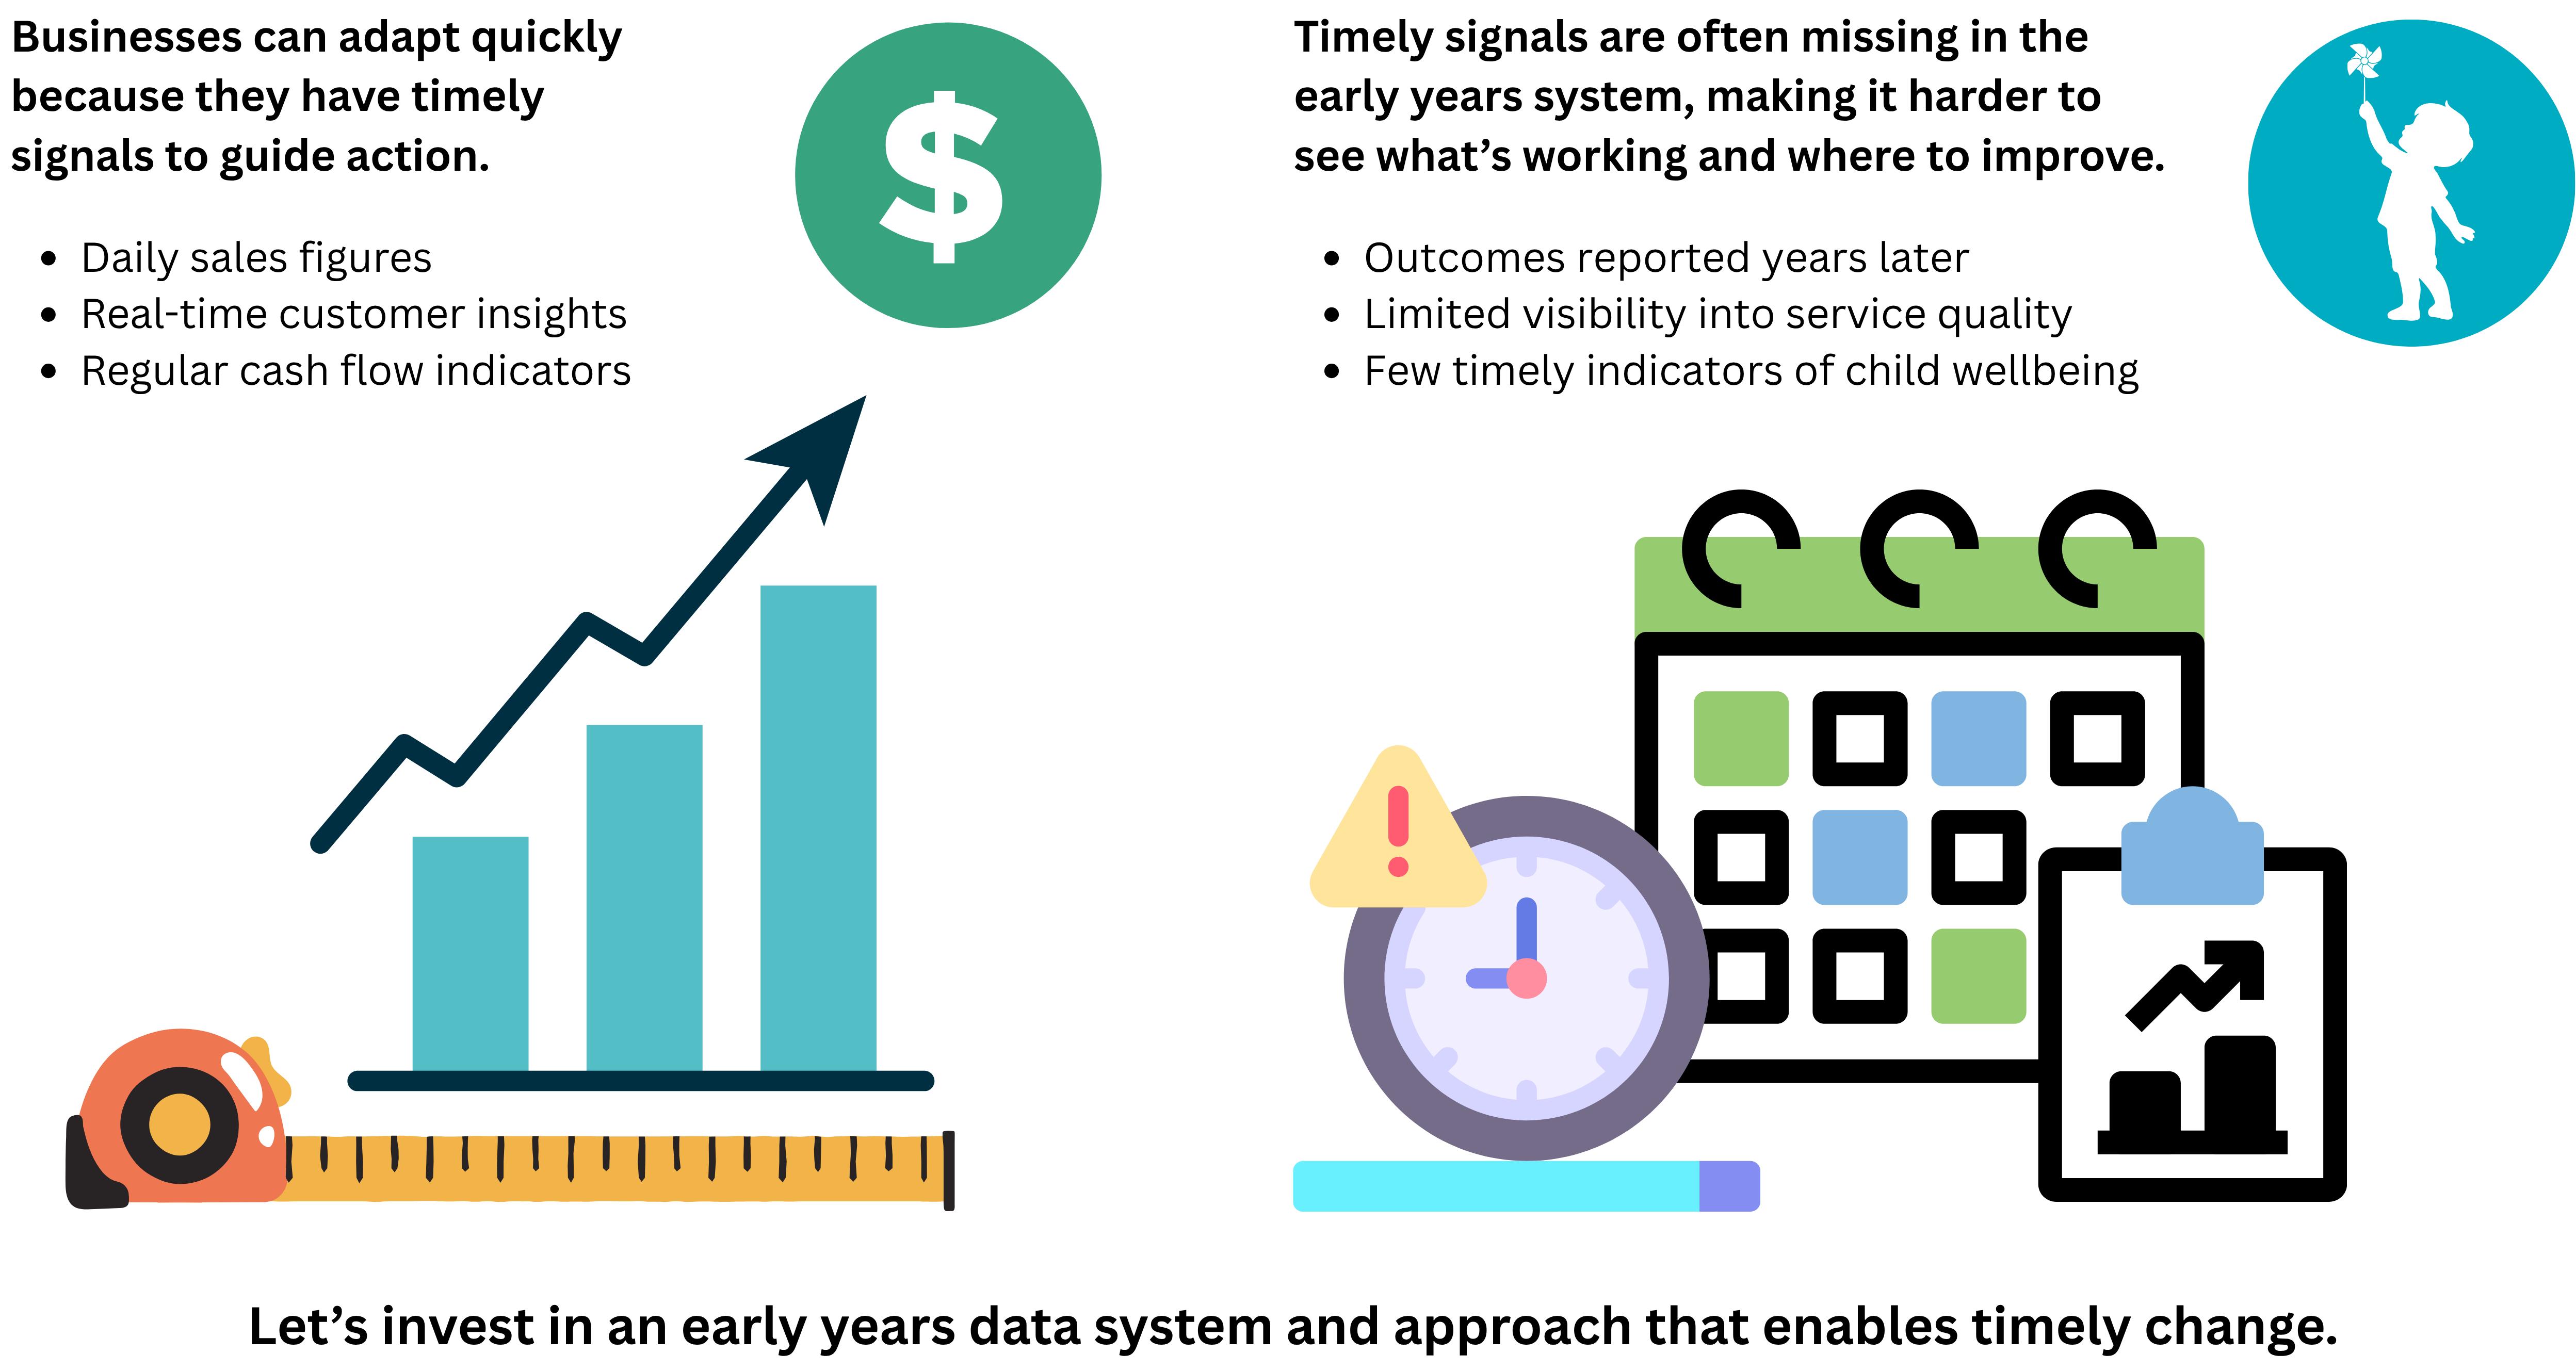
Box 1. Learning from business: The value of early signals
|
Reducing inequities in child development is complex; however, timely, high-quality information gives us the opportunity to respond earlier and more effectively. Across all complex systems, data are the infrastructure that make learning and improvement possible.
In business, measures like customer demand and cash flow provide early signals that guide action. Demand tells a business how much product or service is needed; cash flow signals whether resources are available to meet that need. These measures allow businesses to adapt before problems become entrenched.
In the early childhood sector, we rarely have that kind of immediate, actionable feedback. Instead, we often rely on delayed outcome data – such as school readiness or developmental vulnerability rates – reported years after services have been delivered. This means services can continue unchanged for years before we know whether they are meeting children’s needs.
Early childhood sectors need their own equivalent of these early signals. However, we are comparatively under-invested in the data infrastructure that makes this possible. Without these indicators, we risk repeating the same approaches without knowing if they deliver the best outcomes for children.
 |
Despite strong policy momentum to strengthen and better use data to improve early years services and early years partnerships – including the Early Years Strategy (Australian Government Department of Social Services, 2024), the Productivity Commission inquiry ‘A path to universal early childhood education and care’ (Productivity Commission, 2024) and the Entrenched Disadvantage package (Australian Government Department of Social Services, 2023) – Australia still lacks a cohesive early years data logic: a shared model that sets out what data are needed, for what purpose and how data should be used. The result is a system that is data rich, but insight poor (Molloy et al., 2025).
At the Australian 2025 Early Years Policy summit, ‘harness data, evidence and outcomes’ and ‘elevate the voices of children, families and communities’ were identified as top priorities for reform (National Early Years Policy Summit, 2025). This paper responds with a practical proposal: an early years data logic (Figure 1) to guide better data, better decisions and, ultimately, better, more equitable outcomes for children. The data logic is a structured approach to thinking through which types of data can support which purposes. It highlights different layers of data that, when collected and interpreted strategically, can ensure that the right data are collected, interpreted and used to inform the right actions at the right time.
Figure 1. Early years data logic. © Centre for Community Child Health, Murdoch Children’s Research Institute; reproduced with permission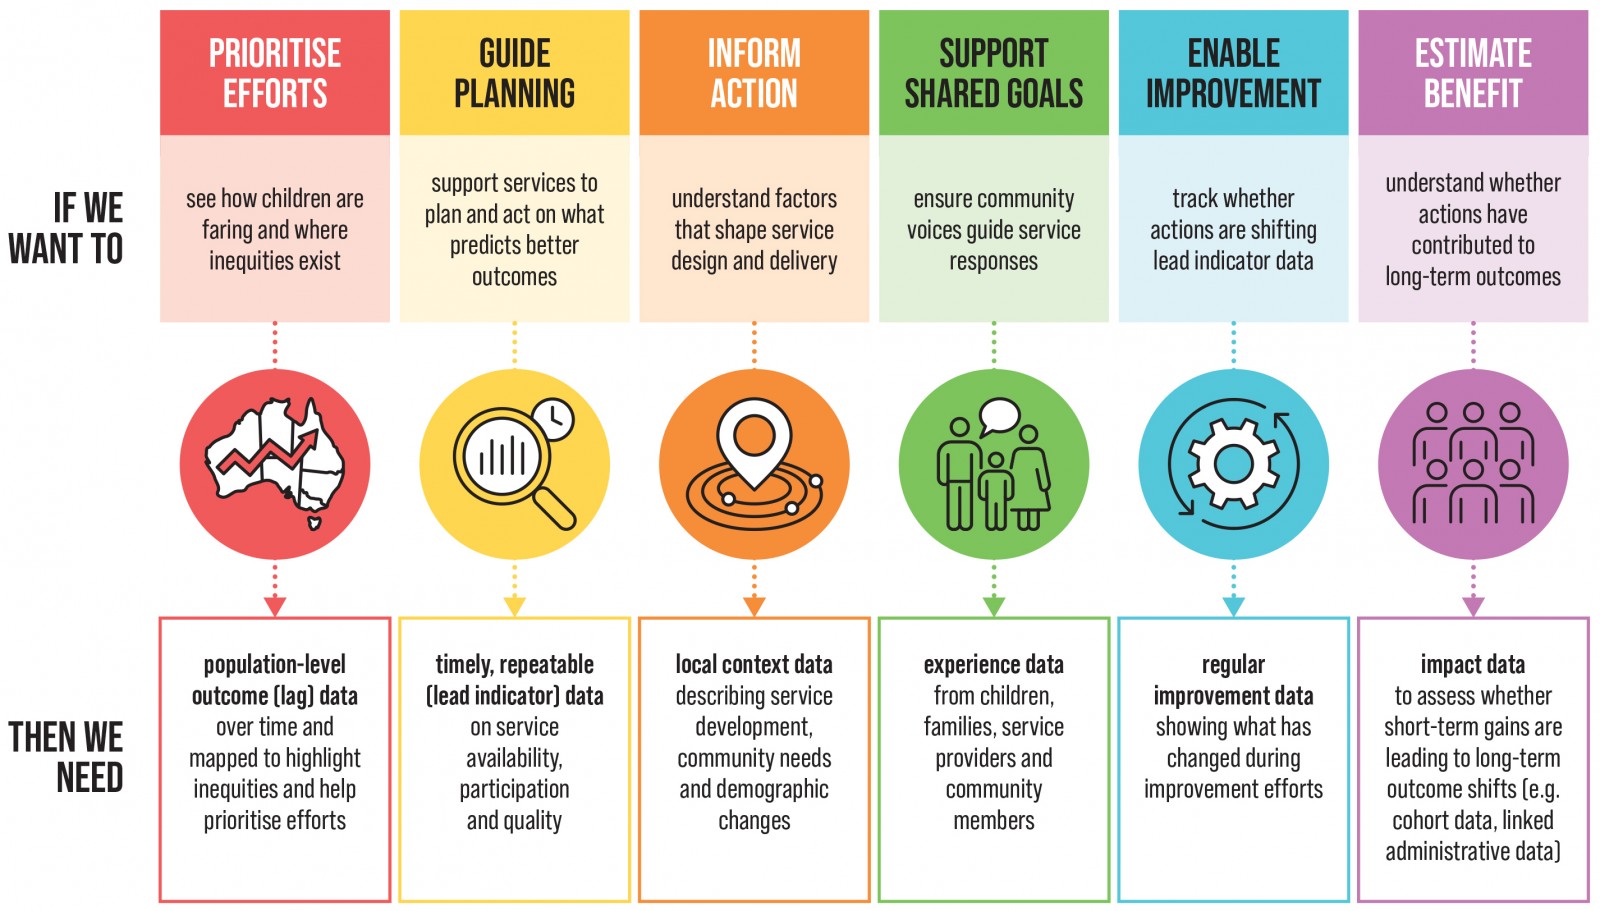
A data logic offers utility to the national data ecosystem, enabling shared goals, coordinated action and system-wide learning. This approach is grounded in radical pragmatism – doing what works, guided by evidence and adapting as knowledge evolves (Gertz & Kharas, 2020; Goldfeld et al., 2024).
This paper draws from work on Restacking the Odds (see Box 2; Restacking the Odds, 2025), including research evidence from five key early years service areas: antenatal care; sustained nurse home visiting; early childhood education and care; parenting programs; and the early years of school. The data logic, therefore, aims to deliver a structured approach to data use, particularly for these types of services, with an additional focus on community-led initiatives (local early years partnerships). We anticipate the data logic would have application for secondary and tertiary services more broadly, and this would be worth testing further.
The data logic is designed to give governments, service providers and local early years partnerships a practical process for generating timely, purposeful and actionable insights – and for making better use of the data they already hold. Unlike existing frameworks or dashboards, which often present static, fragmented or lag measures, the data logic provides a coherent way to layer different types of data, each with a distinct purpose: showing how children are faring, identifying what drives outcomes and tracking whether efforts are working. The data logic addresses key gaps in current approaches, including fragmented reporting, inconsistent stewardship and the absence of a national strategy for sharing and applying data. Crucially, the data logic does not treat data as an endpoint, but as the foundation for evidence that enables better decisions, more effective services and continuous improvement.
Public health is one sector that provides examples of data informing decision making at every level, from the everyday choices of individuals to the national strategy. Families use data to decide when to seek care; doctors use data to diagnose and treat; service providers depend on data for quality improvement; and researchers analyse data to design medicines and test their efficacy. At a population scale, epidemiologists and biostatisticians monitor data to track immunisation coverage, while policymakers interpret data to shape funding and set priorities. Some data serve multiple purposes, while other data are tailored to specific decisions. What matters is that health systems have some sort of logic that connect data to decision needs at every level. Early childhood policy requires the same clarity – without data, decisions remain fragmented, reactive and less effective in meeting the needs of children and families.
If we are serious about equity, we must invest now in the data infrastructure required for timely decisions and meaningful action.
Box 2. Evidence-informed lead indicators in practice
|
Restacking the Odds demonstrated that three drivers – quality, quantity and participation – are critical for reducing inequities and identified evidence-informed lead indicators for antenatal care, early childhood education and care (ECEC), parenting programs, sustained nurse home visiting and early schooling (Molloy et al., 2025). Together with local early years partnerships and services, these lead indicators are being put into practice to fill the missing space in the data ecosystem and equip frontline workers to make changes in a timely manner.
The data dashboard and continuous improvement tools have been critical in overcoming barriers – automatically calculating lead indicators from different datasets and highlighting the evidence of what action to take.
These tools provide a foundation to build out other layers of the data logic – supporting practitioners to include context information and to record and track the impact of their actions. |
Early years data in Australia
Data are used for many purposes in early years systems, from program design and service delivery to local priority setting and national accountability. Across Australia, however, these data systems are fragmented and uneven in their design and governance, reflecting both differing views on which data matter, and practical challenges in collecting data that are meaningful and fit for purpose. System capacity and decision makers’ ability to use data effectively also vary widely. As a result, there is little shared understanding of the value of early childhood data ecosystems or their role in supporting evidence-informed decisions and better outcomes for children.
Many services collect large amounts of meaningful data for their clients, but legacy systems and processes mean they are not always aggregated and reported in ways that inform decisions that matter for service improvement (Beatson et al., 2025). The real challenge is not gathering more data, but aligning data with decisions, priorities and specific contexts (Australian Education Research Organisation, 2022; Shepherd et al., 2015). Working backwards from decisions – asking what evidence different decision makers need, and in what form – creates smarter, more accountable systems that build trust and resilience (Fischer et al., 2025; OECD, 2022; Verhulst et al., 2024).
Yet, as noted, Australia’s data systems remain fragmented. National collections such as the Australian Early Development Census (AEDC) provide important outcome measures, and service providers generate large volumes of compliance and reporting data, but these rarely flow back in ways that help families, services and local early years partnerships act with precision and speed (Beatson et al., 2025).
Another clear example of inconsistent data systems in Australia occurs in child and perinatal data collection. Each state and territory maintains its own perinatal and maternal child health datasets, with different reporting requirements, data items and governance structures (demonstrated in Australian Institute of Health and Welfare’s Australia’s mothers and babies reporting; AIHW, 2025a). There are no nationally consistent guidelines or a federally endorsed practice framework (Price et al., 2025). Despite the existence of the National Perinatal Data Collection (AIHW, 2025b), structural, governance and technical barriers limit cohesion and utility of these data. Victoria’s Maternal and Child Health dataset – one of the most comprehensive in the country – still cannot be routinely linked with other key health or social datasets, limiting its utility for population-level monitoring and early childhood policy development (Price et al., 2025). These fragmented systems result in inconsistent child health monitoring across jurisdictions, hindering the ability to build a unified national picture of maternal and child health outcomes (Shipton et al., 2025).
Research also highlights the barriers to data use identified by local early years partnerships: limited data literacy, constrained access and decision processes that sit outside a coherent data or evidence ecosystem (Sherker et al., 2025; Villanueva et al., 2024). In the UK, promising initiatives seek to create more robust data ecosystems, including the Nuffield Family Justice Observatory’s comparative examination of data gaps and opportunities across the child, youth and family service data ecosystems (Saied-Tessier & Gamboa, 2025), and NESTA’s work bringing together data types to better centre children and local insights in data-driven decision making (Wilcock & Symons, 2023).
At the same time, inequities in availability of, and participation in, high-quality, culturally safe, well-coordinated services persist (McClean, 2025; Tham et al., 2025). Workforce shortages, geographic isolation and uneven attention to quality uplift mean that those who would benefit most from these supports often have the least access – reflecting the ‘inverse care law’ (Hart, 1971; Mercer et al., 2021).
Australia holds substantial data assets, from robust national collections such as the AEDC (Australian Early Development Census, 2025) and the National Assessment Program Literacy and Numeracy (NAPLAN; The Victorian Curriculum and Assessment Authority, 2025), to immunisation registers and linked datasets such as the Person Level Integrated Data Asset (PLIDA; Australian Bureau of Statistics, 2023). Administrative data are reshaping research and policy (Gray et al., 2026). These assets focus on providing or linking to population-level outcome (lag) data (Table 1).
Recent work (Gray et al., 2026, 2023; Pham et al., 2024) has illustrated the potential of linked administrative data but also highlighted its limitations when these data are repurposed to inform population-level equity-focused action. Lead indicators (see Table 2) are often missing, incomplete or of variable quality, reflecting the fact that many data elements were not designed to support timely system-level improvement. These constraints reflect system-level factors, including: how assessments are structured across sectors; practical limits of data capture; limited monitoring of data quality; and poor interoperability between systems. One dimension that is missing is a broader suite of data and indicators that provide the stepping stones to lag data through early and effective action. These data include the following.
- Timely, repeatable (lead indicator) data that signal risks and opportunities earlier;
- Local context data to explain why outcomes look the way they do;
- Experience data that capture the perspectives of families, practitioners and communities to highlight barriers and enablers;
- Regular improvement data that track what actions are being taken and support adaption in a timely way; and
- Impact data that track whether changes are sustained over time.
Without these stepping stones for action, decision makers at all levels do not have a complete picture. Inconsistent definitions, siloed governance, limited access to timely information and burdensome reporting requirements compound the problem. Even basic data points such as a child’s Aboriginal and Torres Strait Islander status, language background or disability status may be defined or collected differently across systems, making it difficult to track participation and outcomes consistently. Children and families who fall into multiple priority groups are often tracked separately, leaving holistic needs invisible.
This fragmentation prevents services from recognising overlaps and coordinating support, potentially leaving needs unmet and often placing the burden on individual families to navigate support. Also missing is clear responsibility for identifying children who are missing out on beneficial supports altogether. Without a coherent data logic, these efforts remain isolated and difficult to scale.
The bottom line: Australia doesn’t need more data. It needs data that are purposeful, timely, accessible and designed to support equity and improvement at every level of the system (Cripps et al., 2025; Shipton et al., 2025).
Table 1. Key terms used in this article
|
Data logic terms |
|
|---|---|
|
Administrative data |
Routinely collected through health, education and social services and generated through everyday service delivery (e.g. enrolments, attendance, developmental assessments, hospital admissions, referrals). These data are often collected to support individual care and service delivery and, when aggregated, can be used at a population level to generate evidence that guides service improvement, strengthens local systems and supports more equitable outcomes. |
|
Cohort data |
Information collected about a defined group of individuals (a cohort) who share a common characteristic, and are followed over time to track their outcomes, experiences or exposures (Mann, 2003). |
|
Impact data |
Data used to assess whether short-term gains are leading to meaningful and sustained long-term outcome shifts. This is not a distinct data type but an analytic use of data relying on longitudinal uses such as cohort data, linked administrative datasets and population-level indicators tracked over time. |
|
Experience data |
Insights into how children and families perceive and engage with services (e.g. feedback on service quality, cultural safety, trust), reported barriers to participation (e.g. cost, transport, language), enablers of engagement (e.g. flexible hours, community connection). Experience-level data complete the picture. These data help us understand where to focus improvement efforts (e.g. to support engagement), the quality experienced by the child or family, what drives exclusion and how to build services that truly work for families. |
|
Indicators |
Measurable signs that shows either the state of a population, the factors that shape it (like behaviours, environment, social conditions), or how well the system is working, and are used to track and evaluate changes over time (Beaglehole et al., 1993; World Health Organization, 2006). Indicators should be relevant, objective, adequate (measuring what they should measure), reliable and sensitive to changes. |
|
Lead indicator data |
Proactive measures that signal future results. They’re often linked to activities that influence the long-term outcome, providing an opportunity to steer efforts early. These indicators are particularly useful in settings where early intervention can improve success rates (Maximizer, 2025a). Lead indicators require evidence-informed measurable targets and accessible data to enable calculation (e.g. numerator and denominator) (Maximizer, 2025b). Combining lead and lag indicators helps early years systems move from reactive to preventive approaches, ensuring timely support and better outcomes for all children. |
|
Population-level outcome (lag) data |
Reflect results after a change process or strategy has been implemented. They’re essential for performance evaluation and long-term planning, confirming what strategies worked and where further targeted (population or geographic) action is required (Maximizer, 2025b). |
|
Regular improvement data |
Regular information collected to monitor changes resulting from action, including from evaluations and key performance indicators. |
|
Other key terms used |
|
|
Early years |
A critical period of development in a child’s life, from conception (age 0 years) to the early school years (year 3; around 8 years of age). |
|
Decision makers |
Decisions that impact early childhood experiences are made all the time – by governments, researchers, funders and philanthropists, service providers, local early years partnerships and families who are involved in early systems. In this paper, we refer to these groups collectively as ‘decision makers’ to highlight the active role they play in shaping early years systems. |
|
Early years systems |
The connected set of universal and local services and supports designed to promote the health and development of children from pregnancy to age 8 years. This includes early childhood health systems (e.g. pregnancy, child and family health), education systems (e.g. early childhood education and care, school education), and other systems delivering child, family and social supports (disability, child safety, parenting support). |
|
Early years services |
Includes frontline practitioners (e.g. nurses, educators), service managers and administrators delivering early years services including antenatal care, child and family health services, family support services, early childhood education and care and school education, etc. |
|
Local early years partnerships |
Partnerships that bring together local community and service providers to improve outcomes for young children and their families. These partnerships build on communities’ strengths, assets and knowledge to establish evidence-informed solutions that meet local needs. Included are place-based initiatives and early childhood hubs. |
|
Priority groups |
Children and families that are disproportionately impacted by inequity due to factors including education, employment status, income and ethnicity. |
Why data matter for equity
Inequities in early childhood outcomes are shaped by complex social determinants across the environments in which children live, learn and develop. Improving equity requires we move beyond ‘silver bullet’ solutions and embrace a more complex, stacked approach that combines essential early childhood health, education and social services – guided by timely and relevant evidence (Goldfeld et al., 2024). These inequities are evident in AEDC outcomes, where children in the most disadvantaged communities have almost three times the rates of developmental vulnerability in two or more domains compared with those in the most advantaged areas (20.3% vs 7.6%; Australian Government Department of Education, 2025).
Social determinants span from individual health and development to family resources, service quality and accessibility and the broader policy and system settings that shape children’s environments. They disproportionately affect priority groups (Restacking the Odds, 2025). No single dataset can capture this complexity. Addressing inequities requires data that make disparities visible and guide action. Sometimes this means linked, cross-sector data; at other times, timely experience data or regular improvement data are what matter most.
There is widespread agreement across early years sectors that data are an essential component for achieving equity, providing the fuel for system change. Without data, reform efforts risk being blind, fragmented and directionless. From the Early Years Strategy (Australian Government Department of Social Services, 2024) to the Productivity Commission Inquiry into early childhood education and care (ECEC) (Productivity Commission, 2024), the South Australian Royal Commission into ECEC (Government of South Australia, 2023), and the NSW Government Data Strategy (New South Wales Government, 2021), there is strong policy momentum recognising that better use of data is critical to identifying who is missing out, where gaps exist, and what works to improve outcomes. Despite this consensus, Australia does not yet have a coordinated approach to using early childhood development data in ways that recognise their value as a driver of action and continuous improvement, rather than an endpoint.
An early years data logic can help
A data logic clarifies how information supports change, ensuring the right data are collected, interpreted, and used to inform the right actions at the right time. It provides a practical guide for governments, local early years partnerships, service providers and community organisations to map the pathways from data collection and interpretation to decision making and improvement.
It also creates a clear structure that links data to purpose, making information more usable and reducing fragmentation. It establishes consistent definitions and standards so data can be compared and aggregated across services and jurisdictions. By including service-level, system-level and experience data, it provides a more timely and complete picture of access, quality and equity. Most importantly, it turns data into actionable insights, enabling those closest to children and families to drive meaningful change that they can control.
Other sectors demonstrate how a structured data approach drives coordinated action when embedded in systems. In the housing sector, the Australian Bureau of Statistics (ABS) housing data are combined with state social housing waitlist information to track affordability and inform homelessness service planning. The energy sector integrates provider data through the Australian Energy Market Operator’s (AEMO) National Electricity Market dashboard, which uses real-time consumption and generation data to manage pricing, reliability and emissions reduction targets. In each of these sectors, data are the foundation for regulation, resource allocation and continuous improvement.
Early years systems can benefit from a similar approach, using a structured data logic to guide decisions and drive continuous improvement. This means identifying the outcomes we want for children, the behaviours or practices we want services to adopt and the evidence those services need to act effectively.
A strong data logic moves beyond describing what is measured. It defines the purpose of different forms of data – outcomes, lead indicators, experience data – and shows how each enables decision making, accountability and continuous improvement. It also strengthens the ability to understand intersectionality, revealing patterns that siloed systems might otherwise obscure.
Early years data logic overview
The early years data logic (Figure 1) illustrates how various types of information can be combined to support decisions in early years settings. It provides a structured approach for decision makers in the early years systems to systematically consider what data already exist, what gaps remain and who else might hold pieces of the puzzle. By mapping these connections, partnerships can identify opportunities to work together and tackle different parts of the problem.
The early years data logic is not just a conceptual framework – it is a practical tool for guiding action. It clarifies what evidence is needed, for what purpose, and how different data types can be used together to build a fuller picture of early years systems and services, enabling each decision maker to answer the questions most relevant to their role. This structured approach ensures that evidence is both timely and actionable, enabling continuous improvement and equitable outcomes.
Decisions that shape children’s development are made by many different decision makers. No single decision maker holds all the levers; outcomes depend on how choices at different levels interact. Each decision maker asks different questions and is interested in different parts of the logic, but when aligned through a shared logic, they create a stronger foundation for action and learning.
Researchers already demonstrate what this looks like in practice: they draw on cohort studies and linked administrative datasets to explore the complex, non-linear ways in which evidence contributes to societal impact over time (Gray et al., 2026; O’Connor et al., 2025). An example is Generation Victoria (GenV), a prospective whole-of-state (i.e. Victoria) multipurpose birth and parent cohort (Wake et al., 2022). Enhanced through extensive linkage to state and federal administrative data, GenV will have the richness and breadth of information needed to generate evidence across all aspects of children’s lives (Goldfeld et al., 2024). Building on these approaches, the logic helps align data assets across the system (e.g. using AEDC data both to prioritise action and to evaluate impact). In this way, the logic creates a coherent structure that benefits all decision makers.
Table 2 summarises the six key data types, outlining purpose, examples, and how each can be used by decision makers. While each has a distinct role, their value is strengthened when used together. The purpose of the data logic is to support efforts to address inequities in childhood outcomes by clarifying what data are needed to understand where inequities exist, why they persist, and how action can be targeted. Equity markers, including indicators that capture priority groups in meaningful and consistent ways, therefore need to cut across all data types. These markers make inequities visible and inform more proportionate and coordinated responses to persistent gaps in services and quality.
Table 2. Overview of data types, use and decision makers
| Data type | Data examples | What it shows | Expected utilisation by decision makers |
|---|---|---|---|
|
Population-level outcome (lag) data |
Perinatal outcomes (e.g. birthweight), AEDC, NAPLAN. |
These data show the ‘what’ and ‘where’ What: Population-level outcomes (e.g. how children are faring across the board). Where: From national to local level. |
Government and funders identify system-level needs. Local early years partnerships and servicesset priorities. |
|
Timely, repeatable (lead indicator) data |
Participation rates against evidence, proportion of children attending, service availability, workforce capacity, service quality measures. |
These data show the ‘how’ How: Drivers of outcomes (e.g. service access, participation and quality) - provides early signals of risk and opportunity that can be influenced in a timely way. |
Governments and funders target investment and resourcing to key drivers. Local early years partnerships identify gaps and areas for joined up support. Services adjust practice. |
|
Local context data |
Demographic and socio-economic characteristics, participation by subgroups, workforce capacity and turnover, service capacity and waitlists, access barriers (e.g. transport, cost). |
Explains why indicators look the way they do – captures realities of services and environments. |
Governments and funders calculate resourcing needed faction. Local early years partnerships and services identify priority actions to trial. |
|
Experience data |
Feedback surveys, child voice activities, perceptions of accessibility, cultural safety, responsiveness or barriers to engagement. |
Family, practitioner and community perspectives – reflects lived experiences with services. |
Local early years partnerships and services co-design and/or adapt relevant solutions – builds trust. |
|
Regular improvement data |
Records about session times, professional mentoring delivery, referral pathways created. |
Shows progress and implementation of planned responses, and whether they are making a difference. |
Local early years partnerships adapt actions. Services refine implementation. |
|
Impact data |
Generation Victoria (GenV). |
Short and long-term change in outcomes, for whom, and where gaps remain. |
Governments, funders, local early years partnerships and services assess sustained impacts. |
Population-level outcome (lag) data are widely used, providing crucial signals of how children are faring and where inequities exist (Molloy et al., 2025). However, they only reflect what has already happened – often too late for timely action. By contrast, evidence-informed lead indicators offer earlier signals of risk and opportunity because they measure the conditions and drivers that research and practice show to predict outcomes.
By showing whether children and families are accessing the right services at the right amount and quality, these indicators turn abstract goals into concrete signals for action. Despite their importance, evidence-informed lead indicators are often missing from routine reporting, even though they can often be calculated from existing data. For example, most early years services will capture attendance records, but these are rarely reported or analysed to identify whether children or families participated enough to benefit, or whether priority cohorts were over-represented in patterns of under-attendance. Governments collect workforce census data, but local early years partnerships and services cannot access the data in ways that support practical planning for how many services are needed or how quality should be improved.
Embedding relevant, repeated and timely indicators into routine practice is essential for driving equitable outcomes. Mapping them makes inequities visible, aligns needs with resources and supports decisions that reflect local priorities and cultural safety (Restacking the Odds, 2025). With fit-for-purpose tools, training and strong leadership, data become a powerful enabler of continuous improvement.
The logic ultimately provides a structure for different decision makers to cooperate and ensure data are utilised to inform key decisions that improve children’s outcomes. The logic provides a shared structure for decision makers to align and use data to inform action, increasing the value of existing data, much of which may be high-quality and purposeful at the individual level, by enabling it to be used more effectively at scale. Box 3 provides a hypothetical example of how the early years data logic could be applied in an early years partnership.
Box 3. Hypothetical case study: How the data logic could guide a local early years partnership
|
We can see how the data logic comes to life by looking at how different data types build a connected picture on the example topic of early reading scores in the AEDC.
A local early years partnership is keen to understand how children in their community are faring, and especially to identify areas of focus where they can prioritise action. When the early years data logic is applied, each type of data helps the partnership take action.
Outcome data, such as the AEDC 2024, is accessed by the early years partnership governance group, and shows that children in the community are significantly behind in early language compared with both the national average and the neighbouring communities.
Evidence-informed lead indicators, collated from local providers, then highlight that ECEC participation is especially low among a priority group of children. Local context data, applied collectively by the early years partnership members, reveal barriers behind these patterns – for example, mapping shows that the new kindergarten is not close to public transport, while workforce data point to high turnover among child health nurses.
Experience datasourced from service providers add the voices of families and service providers, showing that some services feel unwelcoming or culturally unsafe and that referral pathways are unclear.
Armed with this fuller picture, the partnership working group members agree to trial actions and document improvement data – routinely measuring attendance alongside the implementation of the actions and identifying what resulted in change and whether changes were sustained. This shows the effect of these actions – for example, whether an early years navigator role is helping families connect with services and supporting practitioners to make warm referrals.
Over time, impact data (e.g. cohort data or linked administrative data) show whether outcomes are improving – for example, the AEDC 2027 might reveal stronger early language development for priority groups.
This hypothetical example shows how layered data turn scattered information into a shared story of need and progress, helping local early years partnerships see both the challenges and the solutions as part of one connected picture. |
Discussion and implications
A pathway for better decisions, not just more data
Early years systems generate vast amounts of data, but without a clear logic, these data can be overwhelming, fragmented and under-used. A shared data logic provides signposting to follow.
The logic is designed for use by government, local early years partnerships and service providers, offering a clear structure that links data to purpose: which data we need, why we need the data and how data should be used.
It provides a discipline for digging deeper – clarifying which data matter to support action and improvement. This also ensures data flows quickly back to practice, enabling timely adaptation and continuous improvement.
When decision makers have a common understanding of data utility, it provides a platform to establish processes and agreements for appropriate data sharing. For example, it provides greater clarity on what data are needed by frontline services to calculate lead indicators, and an impetus for governments to facilitate access to population data necessary to do so. This also aids understanding of what capabilities are required to analyse and use data (Verhulst et al., 2024).
The data logic is consistent with good data governance, where data are treated as an asset at each point, supported by a framework of policies, processes and responsibilities that ensure proper management, quality, security and compliance.
Implications for government
Multiple government departments at federal, state, territory and local levels have remits relevant to early years partnerships and service provision. Fragmented responsibilities and differing approaches to data collection, stewardship and sharing are key reasons a consistent approach – flexible enough to meet the purposes – is needed.
For governments, adopting a shared early years data logic has wide-reaching benefits. It enables a more coherent national and state approach, where definitions, governance and integration are consistent across services and jurisdictions rather than fragmented. This coherence supports better monitoring of access, quality and equity, and allows reforms to be targeted where the need is greatest.
Governments can use the logic to review existing data, identify gaps and ensure decision making is supported by the right balance of evidence, including timely, actionable lead indicators and experience data capturing the perspectives of families, practitioners and communities. By strengthening system oversight of quality, the logic enables governments to identify emerging safety risks and better ensure safeguarding is built into the system. Common definitions – such as identifying priority groups – further ensure that governments, funders and local early years partnerships operate with a shared understanding of who they are trying to reach and support, reducing duplication and improving the utility of data collection.
While fully integrated, whole-of-government data stewardship remains an ambitious objective, a shared data logic provides a practical rubric as a starting point. It establishes a consistent foundation, clarifies where gaps exist, and complements existing outcomes frameworks used across jurisdictions (e.g. National Early Years Strategy Outcomes Framework, Australian Government Department of Social Services, 2024; New South Wales Wellbeing and Performance Framework, New South Wales Government, 2025; and the Decadal Plan for Social Science Research Infrastructure 2024–33, Academy of the Social Sciences in Australia, 2024). The logic enables oversight of cross-system initiatives, such as the early intervention initiative Thriving Kids (Australian Government Department of Health, Disability and Ageing, 2025), to ensure they operate effectively and reach all children who need them.
A shared approach also lays groundwork for future system integration, supporting more connected service responses across early childhood, family support, health and protection systems (Australian Government Department of Social Services, 2024). There is conceptual work underway in Australia’s child protection and domestic and family violence spaces to better connect systems to provide more holistic support such as through ‘Safe and Supported: The National Framework for Protecting Australia’s Children 2021–31’ (Australian Government Department of Social Services, 2021). However, we note that none of these sufficiently joins up the different levels of data necessary for actual system change. We believe the data logic goes some way to being explicit about what is really needed.
Implementing a shared data logic also has budgetary and operational implications. It requires sustained investment in infrastructure, platforms, dashboards, workforce capability and governance to enable consistent data collection and reporting. An explicit equity lens is essential, ensuring data highlight and respond to gaps for priority groups.
The Australian Government is well placed to steward the logic, linking it to national initiatives such as the Early Years Strategy and early health, learning and social support investments, while national data agencies provide guidance. State and territory governments – including departments of education, health, family and children and social services – play critical roles in implementing standards, contributing data and ensuring data are accessible and comparable across jurisdictions.
Implications for research
Further research is needed to identify which data matter most for decision making across key stakeholders, and how they link directly to outcomes for children and families. Initiatives like GenV make it possible to establish an evidence base for identifying early life factors impacting outcomes, showing how cohorts can function as population-scale research infrastructure (Gray et al., 2026). This will allow us to define the most common and useful indicators to guide action and investment. Similar work has been completed in the youth justice system in England and Wales’, where coordinated, cross-sector work involving the Ministry of Justice, Youth Justice Board, frontline services, inspectorates and other government departments led to the development of new Key Performance Indicators (KPIs; Youth Justice Board, 2025). These KPIs use lead indicator data to support decision making in the multi-agency model and system-level performance management.
Implications for funders
For philanthropic funders, a shared data logic provides both a discipline and an opportunity. It enables them to direct resources more strategically, backing interventions that are demonstrably linked to improved outcomes rather than spreading investments thinly. Beyond this, funders can adopt the data logic as part of their own evaluation frameworks, embedding a common structure into how they monitor grants, track progress across portfolios and assess impact. Importantly, funders can also take on a catalytic role, supporting pilot sites to build skills and infrastructure that support collective interpretation and continuous improvement – through data systems that track long-term change and provide timely feedback.
Philanthropic and government funders should additionally ensure funding supports building relevant capabilities of local early years partnerships and services – such as fit-for-purpose software and tools, and required training in data literacy and continuous improvement.
Implications for local early years partnerships
For local early years partnerships, the introduction of a data logic strengthens local ownership and agency. Instead of being passive recipients of policy or service delivery, communities gain access to timely, relevant information that allows them to set priorities based on their own contexts and advocate for resources accordingly. This transparency builds trust, making it clearer what is working and where gaps remain. Communities are also empowered to coordinate action across services more effectively, with data providing a common reference point. In practice, this means partnerships, local government or backbone organisations can adapt their strategies quickly, rather than waiting years for outcome data to tell them what they already know anecdotally. Local early years partnerships should ensure data are used for decision making, and engage children, families and communities in translating insight to action.
Implications for early years services
For early years services including ECEC, child and family health, or parenting programs, the implications are both practical and cultural. Practically, services can shift from relying on lag outcome data to working with timely lead indicators and improvement data, which allow them to adjust practice in a timely way (Molloy et al., 2025). Culturally, the use of a shared logic encourages services to see their role within a broader ecosystem, understanding not only what happens within their walls but how they contribute to community-wide goals.
Many communities have limited access to high-quality services or have services that lack the resources and remit to effectively adapt and overcome accessibility barriers (e.g. outreach), an enduring manifestation of the inverse care law (Hart, 1971). Shared measurement of services, who is attending them, and why or why not, enables early years services and governments to work in partnership to reach underserved children and families.
This requires investment in professional capability, ensuring that data are not seen as compliance but as tools for reflection, learning and continuous improvement. Building local capacity in data collection and use strengthens local ownership, improves engagement and leaves a legacy of skills (Kavanagh et al. 2025) In this way, services become more agile, collaborative and accountable to the children and families they serve.
Implications for data governance
The opportunities and challenges of using linked administrative data are well documented. Key challenges reflect both data limitations and system constraints, including: variable data quality and completeness; bias and data lags; governance, ethical and privacy barriers; limited technical capability and collaboration; and gaps in population coverage, reliance on proxy reporting, and missing social and structural indicators (Gray et al., 2026). In early childhood contexts, data validity and reliability are variable, reflecting heterogeneous assessment practices and administrative systems not designed for population monitoring.
Even where technical quality is high, large-scale individual-level linked data carry risks of misuse or misinterpretation, underscoring the importance of strong governance and ethical safeguards (Gray et al., 2026). To mitigate these risks and realise the potential of the data logic model, governance must extend beyond access control to include clear accountability for data stewardship, transparency of decision making, protection of confidentiality, appropriate consent arrangements and mechanisms to ensure data quality and security.
Governance needs may also vary with data types – with publicly available lag outcome data having a much lower requirement compared with types requiring service or individual consent. Governance must also comply with Indigenous data sovereignty (Maiam nayri Wingara Indigenous Data Sovereignty Collective, 2024) – ensuring Aboriginal and Torres Strait Islander Peoples and services have the right to govern data that pertain to them.
Conclusion
Australia stands at a pivotal moment in early childhood reform. Despite substantial investment, inequities persist in health, development and wellbeing outcomes for children. The missing link is not more data, but better data – data that is connected, purposeful and used to drive change.
This paper has outlined a practical data logic that clarifies what data are needed, for what purpose and by whom. When embedded across early years systems, this logic enables a shift from fragmented efforts to coordinated action, from reactive responses to proactive support, and from isolated initiatives to shared goals. Initiatives such as Restacking the Odds show what is possible when different types of data along the pathway are connected and used to guide improvement. They demonstrate how timely, actionable insights can strengthen service delivery, support accountability and build trust with communities.
Just as businesses thrive by turning data into timely decisions, early years systems must move beyond collecting data to using it with purpose. This is not just a technical fix; it is a moral and strategic imperative. It enables us to see who is missing out, understand what works, support service improvement and track progress over time. Most importantly, it centres children and families in the data story, ensuring their voices and experiences shape the systems designed to support them.
This paper presents a starting point to build upon. When governments set the conditions, funders invest in capability and early years partnerships lead local learning, the system begins to generate its own evidence – born of real improvement efforts – that can inform better policy, service delivery and outcomes for children. The opportunity is clear. The tools exist. What’s needed now is leadership, collaboration and commitment to build a data ecosystem that delivers on the promise of equity and better outcomes for all children.
Knowledge translation and impact
The current problem
Despite decades of investment in early years services, many Australian children still miss out on the support they need to thrive.
The issue isn’t a lack of data. Governments, early years services and early years partnerships collect lots of data through health records, service reports and monitoring systems.
The problem is that there isn’t always the right kind of data to support timely, meaningful decision making. The early years system often lacks usable, up-to-date insights that show which children are missing out, what’s working and where improvement is needed.
Imagine running a business without knowing your daily sales, only receiving a profit report years later. You’d struggle to spot problems or make quick adjustments. This is essentially how Australia’s early years systems operate – relying on delayed indicators such as school-readiness assessments that arrive years after services have been delivered. By then, the opportunity to help children and families who are struggling has passed.
National data collections, like the Australian Early Development Census (AEDC), offer valuable data but rarely provide the kind of timely, actionable insights that frontline services and communities need to make timely and meaningful improvements.
A solution: a data logic for early childhood
A data logic is a structured approach that clarifies what types of data the early years system needs, for what purpose and how to use them effectively. Think of it as a roadmap that ensures the right data reaches the right people at the right time to support better decisions.
The proposed data logic (Figure 2) identifies six key types of data.
Population-level outcome (lag) data shows how children are ultimately faring – like school readiness scores or developmental assessments. These data reveal where problems exist but come too late for immediate action.
Evidence-informed lead indicators are early warning signals or predictors of outcomes. For example, instead of waiting years to see if children are school ready, we can track whether 2-year-olds are enrolled in high quality early childhood education and care (ECEC) for at least 15 hours per week, which sets them up for school. Lead indicators turn abstract goals into concrete, measurable targets that services can act on immediately.
Local context data explain why indicators look the way they do – factors like staffing levels, transport barriers or service availability that affect whether families can access services.
Experience data capture the voices of children and families, practitioners and communities about whether services feel welcoming, culturally safe and responsive to their needs.
Regular improvement data track what actions are being taken to address problems – like new session times or referral pathways.
Impact data reveal whether these efforts are making a difference over time and for whom.
The purpose of the data logic is to support equity in childhood outcomes, by making clear what data are needed to understand where gaps exist and why, and how action can be targeted.
How this works
Consider a local early years partnership that notices low ECEC participation among a priority group of children in their community. The early years partnership can use the data logic to ask different questions about how:
- Lead indicators reveal the participation gap;
- Local context data show limited transport options to services;
- Experience data indicate families have cultural reasons for not attending;
- Improvement data track new initiatives like cultural mentoring programs; and
- Impact data analyse administrative data, collected through service delivery over time to monitor whether participation improvements last.
This layered approach enables the partnership to understand what’s happening, why, and what actions might help.
Why it matters
When different decision makers, like governments, service providers and local early years partnerships share a common understanding of what data mean and how to use data, they can coordinate more effectively. Services can adapt in a timely manner rather than waiting years for feedback. Local early years partnerships gain insights to advocate for resources they need. And governments can target investment where it will make the biggest difference.
The path forward
The goal isn’t collecting more data; it’s using data more effectively. Just as successful businesses turn information into timely decisions, early years systems must shift from simply collecting data to using data with clear purpose. This requires investment in infrastructure, training and governance. Most importantly, it means keeping children and families at the centre, ensuring their experiences shape the systems designed to support them.
Figure 2. Simplified version of the early years data logic. © Centre for Community Child Health, Murdoch Children’s Research Institute; reproduced with permission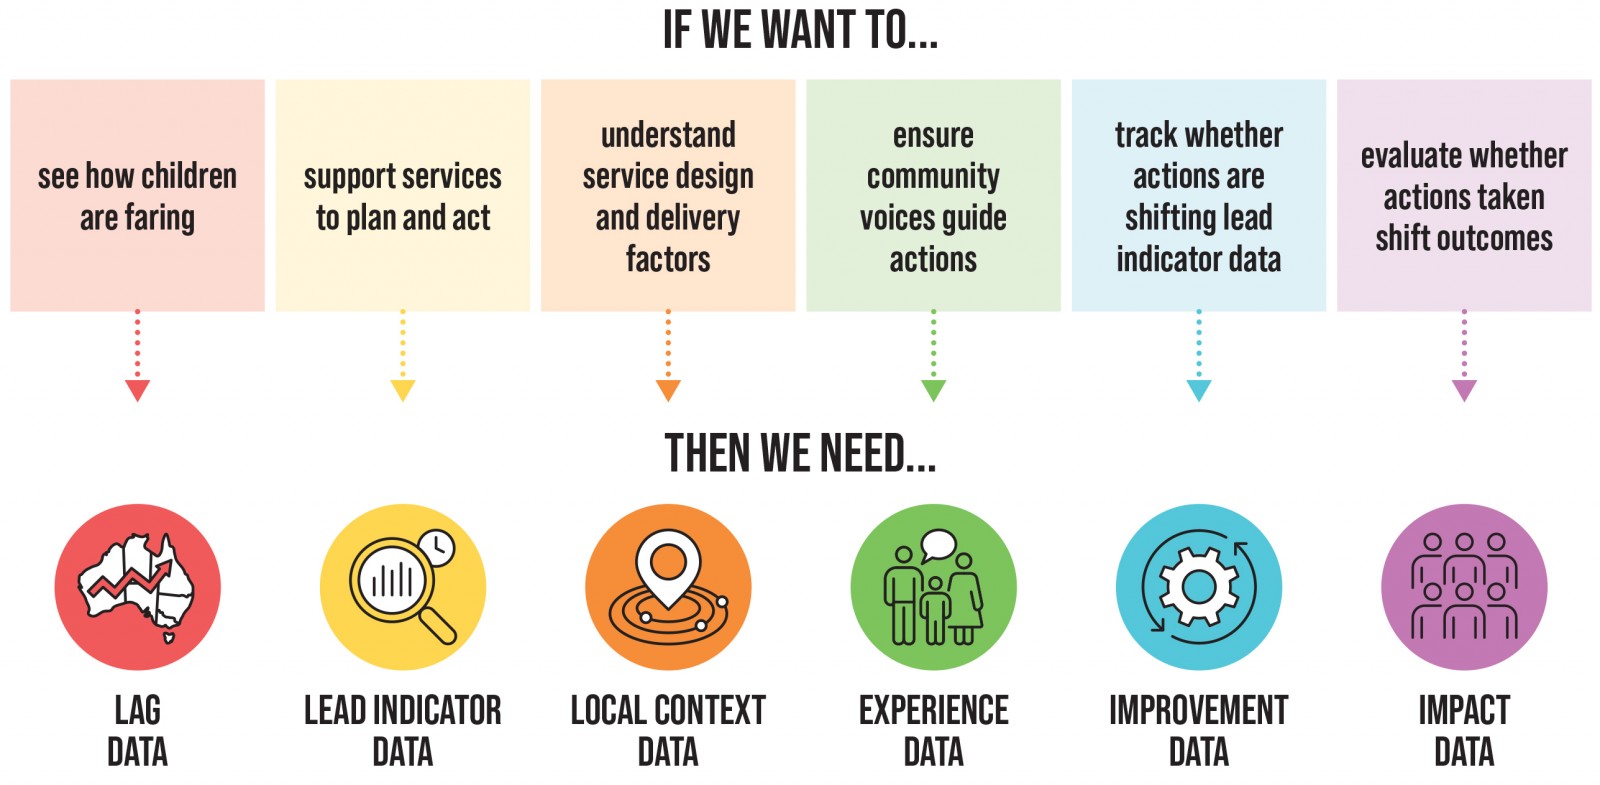
Funding statement
This work was supported by the Paul Ramsay Foundation, Minderoo Foundation and Victorian Government’s Operational Infrastructure Support Program. Prof. Goldfeld is supported by an Australian National Health and Medical Research Council (NHMRC) 2023 Investigator Grant [2026263]. The funding sources had no involvement in: study design; collection, analysis or interpretation of data; writing of the report; or the decision to submit the article for publication.
Conflicts of interest
The authors declare no conflicts of interest.
AI statement
During the preparation of this work, the authors used Microsoft Copilot (M365) to improve language clarity and readability. The authors reviewed and edited all content generated with this tool and take full responsibility for the final manuscript.
References
Academy of the Social Sciences in Australia. (2024). Connected, Innovative and Responsive: Decadal Plan for Social Science Research Infrastructure 2024–33. Canberra, Australia: Academy of the Social Sciences in Australia. education.gov.au https://www.education.gov.au/system/files/2025-12/189_Roadmap%20Survey_%20Academy%20of%20the%20Social%20Sciences%20in%20Australia_%20Attachment.pdf
Australian Bureau of Statistics. (2023). Person Level Integrated Data Asset (PLIDA). Canberra, Australia: Australian Bureau of Statistics. abs.gov.au https://www.abs.gov.au/about/data-services/data-integration/integrated-data/person-level-integrated-data-asset-plida
Australian Early Development Census. (2025). Home page. aedc.gov.au https://www.aedc.gov.au
Australian Education Research Organisation. (2022). Early childhood data in Australia: Scoping report. Melbourne, Australia: AERO. edresearch.edu.au https://www.edresearch.edu.au/sites/default/files/2022-06/Early-childhood-data-scoping-report_AA.pdf
Australian Government Department of Education. (2025). AEDC National Report 2024: Early childhood development in Australia. Canberra, Australia: Australian Government. aedc.gov.au https://www.aedc.gov.au/resources/detail/2024-aedc-national-report
Australian Government Department of Health, Disability and Ageing. (2025). Thriving kids. Canberra, Australia: Australian Government. health.gov.au https://www.health.gov.au/our-work/thriving-kids?language=en
Australian Government Department of Social Services. (2021). Safe and Supported: The National Framework for Protecting Australia’s Children 2021–31. Canberra, Australia: Australian Government. dss.gov.au https://www.dss.gov.au/system/files/documents/2024-10/dess5016-national-framework-protecting-childrenaccessible.pdf
Australian Government Department of Social Services. (2023). Entrenched disadvantage package. Canberra, Australia: Australian Government. dss.gov.au https://www.dss.gov.au/publications-articles-corporate-publications-budget-and-additional-estimates-statements/entrenched-disadvantage-package
Australian Government Department of Social Services. (2024). The Early Years Strategy 2024–2034. Canberra, Australia: Australian Government. dss.gov.au https://www.dss.gov.au/system/files/resources/early-years-strategy-2024-2034.pdf
Australian Institute of Health and Welfare (AIHW). (2025a). Australia’s mothers and babies: State and territory perinatal data collections. Canberra, Australia: AIHW. aihw.gov.au https://www.aihw.gov.au/reports/mothers-babies/australias-mothers-babies/contents/technical-notes/state-and-territory-perinatal-data-collections
Australian Institute of Health and Welfare (AIHW). (2025b). National perinatal data collection. Canberra, Australia: Australian Government. aihw.gov.au https://www.aihw.gov.au/about-our-data/our-data-collections/national-perinatal-data-collection
Beaglehole, R., Bonita, R., & Kjellström, T. (1993). Basic epidemiology. Geneva, Switzerland: World Health Organization. iris.who.int https://iris.who.int/bitstream/handle/10665/36838/9241544465.pdf
Beatson, R., Macmillan, C. M., Sherker, S., Hilton, O., Goldfeld, S., & Molloy, C. (2025). Improving data-based decision-making in early childhood services: A systematic review informed by the Capability Opportunity and Motivation model of Behavior. Child & Youth Services. DOI https://doi.org/10.1080/0145935X.2025.2468185
Cripps, S., Lopatnikova, A., Afshar, H. M., Gales, B., Marchant, R., Francis, G., Moreira, C., & Fischer, A. (2025). Bayesian adaptive trials for social policy. Data & Policy, 7, e27. DOI https://doi.org/10.1017/dap.2024.97
Commission on Social Determinants of Health. (2008). Closing the gap in a generation: Health equity through action on the social determinants of health. Final Report of the Commission on Social Determinants of Health. Geneva, Switzerland: World Health Organization. who.int https://www.who.int/publications/i/item/WHO-IER-CSDH-08.1
Fischer, A., Cameron, G., Tilus, C., Espey, J., & Badiee, S. (2025). Revisiting the assumptions of the data revolution as an accelerator of the sustainable development goals. Data & Policy, 7, e49. DOI https://doi.org/10.1017/dap.2025.10015
Gertz, G., & Kharas, H. (2020, 16 October). Radical pragmatism: Policymaking after COVID. Democracy: A Journal of Ideas. democracyjournal.org https://democracyjournal.org/arguments/radical-pragmatism-policymaking-after-covid
Goldfeld, S., O’Connor, E., Pham, C., Gray, S. & Changing Children’s Chances Investigator Group. (2024). Beyond the silver bullet: Closing the equity gap for children within a generation. Medical Journal of Australia, 221(10), 508–511. DOI https://doi.org/10.5694/mja2.52493 PMid:39434240
Government of South Australia. (2023). Royal Commission into Early Childhood Education and Care: Final report. Adelaide, Australia: Government of South Australia. royalcommissionecec.sa.gov.au https://www.royalcommissionecec.sa.gov.au/__data/assets/pdf_file/0009/937332/RCECEC-Final-Report.pdf
Gray, S., Guo, S., O’Connor, M., O’Connor, E., Williams, K., Badland, H., Woolfenden, S., Dickerson, J., Redmond, G., Downes, M., & Goldfeld, S. R. (2026). Data for equity: Can linked administrative data inform pathways to more equitable child health? Medical Journal of Australia, 224(3), e70149. DOI https://doi.org/10.5694/mja2.70149 PMid:41772911
Gray, S., Pham, C., Guo, S., Downes, M., O’Connor, E., Priest, N., & Goldfeld, S. (2023). Measuring vulnerability and disadvantage in early childhood data collections: A report for the Australian Government Department of Education. Melbourne, Australia: Centre for Community Child Health, Murdoch Children’s Research Institute. doi.org https://doi.org/10.25374/MCRI.21974780
Hart, J. (1971). The inverse care law. The Lancet, 297(7976), 405–412. DOI https://doi.org/10.1016/S0140-6736(71)92410-X PMid:4100731
Heckman, J., & Masterov, D. (2007). The productivity argument for investing in young children. Review of Agricultural Economics, 29(3), 446–493. DOI https://doi.org/10.1111/j.1467-9353.2007.00359.x
Kavanagh, B., Versace, V., Beks, H., Dennis, C., Binder, M., & Herman, A. (2025). Evaluation capacity building in a rural Victorian community service organisation: A formative evaluation. International Journal of Research and Method in Education, 48(3), 272–289. DOI https://doi.org/10.1080/1743727X.2024.2400905
Maiam nayri Wingara Indigenous Data Sovereignty Collective. (2024). Taking control of our data: A discussion paper on Indigenous data governnance for Aboriginal and Torres Strait Islander People and Communities. Melbourne, Australia: Lowitja Institute. DOI https://doi.org/10.48455/rtvd-7782
Mann, C. J. (2003). Observational research methods. Research design II: Cohort, cross sectional, and case-control studies. Emergency Medicine Journal, 20(1), 54–60. DOI https://doi.org/10.1136/emj.20.1.54 PMid:12533370
Maximizer. (2025a). CRM pipeline management: Maximize your sales pipeline. Vancouver, Canada: Maximizer. maximizer.com https://www.maximizer.com/solutions/crm-pipeline-management
Maximizer. (2025b). Leading vs lagging indicators: Definition and examples. Vancouver, Canada: Maximizer. maximizer.com https://www.maximizer.com/blog/leading-vs-lagging-indicators
McClean, T. (2025). High quality early learning deserts: A spatial analysis of supply and enrolment. White Paper. Sydney, Australia: Research and Social Policy Team, Uniting. uniting.org https://www.uniting.org/content/dam/uniting/documents/community-impact/research-and-innovation/2024/whitepaper-quality-early-learning-deserts.pdf
Mercer, S. W., Patterson, J., Robson, J. P., Smith, S. M., Walton, E., & Watt, G. (2021). The inverse care law and the potential of primary care in deprived areas. The Lancet, 397(10276), 775–776. DOI https://doi.org/10.1016/S0140-6736(21)00317-2 PMid:33640047
Mitchell Institute. (2025). Mitchell Institute Research Spotlight: The Australian Early Development Census 2024. Melbourne, Australia: Mitchell Institute, Victoria University. content.vu.edu.au https://content.vu.edu.au/sites/default/files/documents/2025-08/mitchell-institute-research-spotlight-aedc-2024.pdf
Molloy, C., Perini, N., Harrop, C., & Goldfeld, S. (2025). Evidence-based lead indicators to drive equitable early years services: Findings from the Restacking the Odds Study. Child Indicators Research, 18(2), 789–823. DOI https://doi.org/10.1007/s12187-025-10215-z
National Early Years Policy Summit. (2025). Summit communique. airdrive.eventsair.com https://airdrive.eventsair.com/eventsairaueprod/production-earlyyears-public/2c314b79cd63498488e8ab2a14a5a794
New South Wales Government. (2021). NSW Government Data Strategy. Sydney, Australia: New South Wales Government. data.nsw.gov.au https://data.nsw.gov.au/sites/default/files/inline-files/NSW%20Government%20Data%20Strategy_0.pdf
New South Wales Government. (2025). Performance and Wellbeing Framework. Sydney, Australia: New South Wales Government. nsw.gov.au https://www.nsw.gov.au/nsw-government/public-sector/financial-information-for-public-entities/centre-for-economic-evidence/nsw-government-investment-framework/performance-wellbeing-framework [Retrieved 6 January 2026]
O’Connor, M., Knight, K., O’Connor, E., Hughes, E., Goldfeld, S., & Olsson, C. (2025). An Australian perspective on opportunities to innovate and evolve impact in cohort studies. Longitudinal and Life Course Studies, 16(3), 407–417. DOI https://doi.org/10.1332/17579597Y2025D000000046 PMid:40557596
Organisation for Economic Co-operation and Development (OECD). (2022). Building trust to reinforce democracy: Main findings from the 2021 OECD survey on drivers of trust in public institutions. Paris, France: OECD. DOI https://doi.org/10.1787/b407f99c-en
Pham, C., Downes, M., Guo, S., Jahan, F., De Silva, S., O’Connor, E., Gray, S., Priest, N., & Goldfeld, S. (2024). Measuring vulnerability and disadvantage in early childhood data collections: Phase two. Melbourne, Australia: Centre for Community Child Health, Murdoch Children’s Research Institute. doi.org https://doi.org/10.25374/MCRI.26300749
Price, A., O’Connor, E., & Goldfeld, S. (2025). The importance of universal child and family health services for equitable early development. Medical Journal of Australia, 223(8), 387–390. DOI https://doi.org/10.5694/mja2.70067 PMid:41025214
Productivity Commission. (2024). A path to universal early childhood education and care. Final report from the inquiry into early childhood education and care. Inquiry report no. 106, Vol. 1. Canberra, Australia: Australia Government. pc.gov.au https://www.pc.gov.au/inquiries/completed/childhood/report
Restacking the Odds. (2025). Restacking the Odds Impact Report: Phase Two (2022–2025). Co-Designing for impact: Supporting the use of data in early years systems. Melbourne, Australia: Centre for Community Child Health at The Royal Children’s Hospital and the Murdoch Children’s Research Institute. rsto.org.au https://www.rsto.org.au/media/ymkhmaxk/rsto_impactreport_0625_da5.pdf
Saied-Tessier, A., & Gamboa, A. (2025). Child-focused, data-driven: Learning from youth justice to improve family justice data. London, UK: Nuffield Family Justice Observatory. nuffieldfjo.org.uk https://www.nuffieldfjo.org.uk/resource/child-focused-data-driven-learning-from-youth-justice-to-improve-family-justice-data
Shepherd, K., Hubbard, D., Fenton, N., Claxton, K., Luedeling, E., & de Leeuw, J. (2015). Policy: Development goals should enable decision-making. Nature, 523(7559), 152–154. DOI https://doi.org/10.1038/523152a PMid:26156358
Sherker, S., Villanueva, K., Beatson, R., Macmillan, C. M., Lee, W. Y., Hilton, O., Molloy, C., & Goldfeld, S. (2025). Barriers and facilitators to data-based decision making in Australian early childhood education and care: A qualitative study. Social Sciences & Humanities Open, 11, 101285. DOI https://doi.org/10.1016/j.ssaho.2025.101285
Shipton, A., O’Connor, M., Wake, M., Goldfeld, S., Lees, H., Adams, C., Edvardsson, K., Hooker, L., Mohal, J., Pilkington, R., & Mensah, F. (2025). The potential of maternal and child health service data in Australia: How lessons from the COVID-19 pandemic can accelerate data-informed decision making. Medical Journal of Australia, 222(8), 377–380. DOI https://doi.org/10.5694/mja2.52630 PMid:40090677
Tham, M., Leung, C., Hurley, P., Pilcher, S., & Prokofieva, M. (2025). Unequal from the start: The achievement gap and the early years. Melbourne, Australia: Mitchell Institute, Victoria University. content.vu.edu.au https://content.vu.edu.au/sites/default/files/documents/2025-04/unequal-from-the-start-report-march-2025.pdf
Verhulst, S. G., Chafetz, H., & Fischer, A. (2024, 22 October). The critical role of questions in building resilient democracies. Stanford Social Innovation Review. DOI https://doi.org/10.48558/XBJE-QT81
Victorian Curriculum and Assessment Authority (VCAA). (2025). VCAA NAPLAN Reporting Guide. Melbourne, Australia: Victorian Government. vcaa.vic.edu.au https://www.vcaa.vic.edu.au/sites/default/files/2025-07/2025VCAANAPLANReportingGuide_3.pdf
Villanueva, K., Beatson, R., Hilton, O., Lee, W. Y., Macmillan, C., Molloy, C., Sherker, S., & Goldfeld, S. (2024). Barriers and enablers to data-based decision making in Australian place-based community initiatives: A qualitative study informed by the COM-B Model and Theoretical Domains Framework. Child Indicators Research, 17(6), 2361–2387. DOI https://doi.org/10.1007/s12187-024-10170-1
Wake, M., Goldfeld, S., & Davidson, A. (2022). Embedding life course interventions in longitudinal cohort studies: Australia’s GenV opportunity. Pediatrics, 149 (Suppl. 5), e2021053509R. DOI https://doi.org/10.1542/peds.2021-053509R PMid:35503324
Wilcock, R., & Symons, T. (2023). The future of early-years data. London, UK: Nesta. nesta.org.uk https://www.nesta.org.uk/blog/the-future-of-early-years-data
Woolfenden, S., Goldfeld, S., Raman, S., Eapen, V., Kemp, L., & Williams, K. (2013). Inequity in child health: The importance of early childhood development. Journal of Paediatrics and Child Health, 49(9), 365–369. DOI https://doi.org/10.1111/jpc.12171 PMid:23551940
World Health Organization. (2006). Framework and standards for country health information systems. Geneva, Switzerland: World Health Organization. who.int https://www.who.int/publications/i/item/9789241595940
World Health Organization. (2025). Health equity. Geneva, Switzerland: World Health Organization. who.int https://www.who.int/health-topics/health-equity
Youth Justice Board. (2025). Research and analysis: Quality and methodology information for new KPIs. London, UK: United Kingdom Government. gov.uk https://www.gov.uk/government/publications/quality-and-methodology-information-for-new-kpis/quality-and-methodology-information-for-new-kpis